An introduction to unit economics (and to a drunk and his car keys)
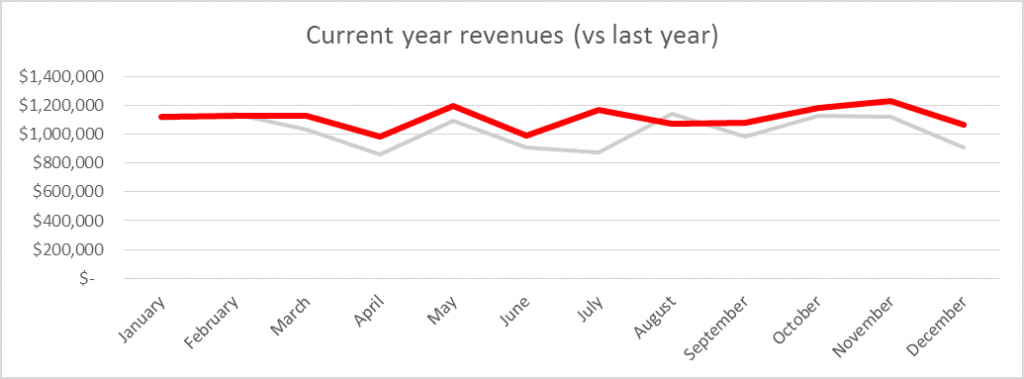
This business is growing at a predictable 20% per year, but you can’t see that from the chart of top-line revenues below.
You can’t see this growth if you look at a profit-and-loss report or a cashflow analysis either.
Consequently, the board is pressuring the management team to shut down their expensive sales experiment. This doesn’t sit well with the management team’s intuition but the facts are the facts.
This company is fictitious. But the story is a common one—and there’s a chance it might be playing-out in your organization right now. Read on to discover the backstory, why the facts are in conflict with reality and what management can do to reconcile this conflict.
The backstory
Our fictitious company commenced a new sales initiative on January 1. It employed two inside salespeople and, consequently, increased annual operating expenses by $200k. Now, 12 months on, the board is examining the organization’s financials and pointing out that it makes no sense to maintain this initiative.
Now, here’s the thing. The organization that generated that revenue chart above really is growing at 20% per year. I know that because I built the model that generated these numbers—and 20% annual growth is hard-wired into the model.
So the 20% annual growth isn’t in dispute (you can download my model and check for yourself). However, the board’s conclusion isn’t in dispute either. Their conclusion may be in conflict with reality but it’s NOT in conflict with the evidence provided by the organization’s management team. Even the most rigorous analysis of the organization’s financial reports will not reveal the truth. Consequently, the management team is about to agree to shut down their inside sales team—a move that will do serious damage to the longer-term outlook of the organization.
The contradiction
To understand the cause of this conflict, you need to understand the model that is generating the chart above.
The model consists of two components. There’s the baseline activity and then there’s the sales initiative. The sales initiative is introduced in the current year, meaning that last year’s numbers show the baseline only.
Baseline
The baseline activity consists of 1,000 customers, who each average $1,000 a month in expenditure. The life of an average customer is 3 years, however organic growth (word of mouth) is exactly equal to the rate of customer atrophy—meaning that the organization averages a steady 1,000 customers and a steady $10m in annual sales.
The sales initiative
The sales initiative consists of two inside salespeople who collectively add 17 new clients each month. 17 new clients each month equates to 200 a year, which is 20% growth. As mentioned earlier, the cost of this initiative is a steady $200k per annum.
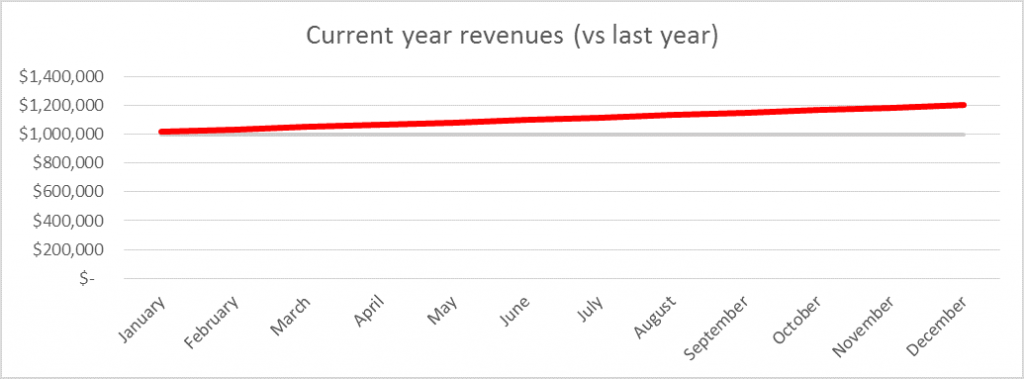
Now, if you model these starting assumptions and chart the monthly revenues, you end up with the following. It’s quite clear from this chart that the sales initiative is driving growth.
Enter variation
It’s also quite clear from this chart that something is missing. Outside of MBAs’ business plans, revenue plots NEVER look like the lines in the chart above. Clearly our model does not account for normal variation.
My model fixes that by introducing variability in two places. First, client expenditure varies (randomly) by ±15% each month ($850-1,150). And, second, the rate of new client acquisition varies (randomly) by ±25% each month (8-25 new clients). I think you’ll agree that both are realistic assumptions.
As soon as we add this variability to our model, something very interesting happens. The steady growth that you can see clearly in the chart above disappears (giving us the chart at the start of this discussion). This growth isn’t just hidden or disguised, it’s gone. Totally. You simply cannot detect its existence by studying this business’s standard financial reports (at least, over a 12-month term).
To attempt to do so is a fool’s errand. It’s like the drunk who looks for his keys under the streetlamp (where he can see), as opposed to near his car, where he lost them (and where it’s dark)!
The reason the evidence of the organization’s growth disappears is that the revenue generated by the sales initiative is significantly less than the variability of the baseline revenue. Of course, it’s further obscured by the variation in the rate of new-client acquisition. The signal, in other words, is obscured by the noise.
Reconciliation: an introduction to unit economics
If the performance of the sales initiative cannot be detected in the standard financial reports, it’s foolish of management to expect the board to be excited by it.
The onus is on management to find a way to identify and communicate the performance of this initiative clearly.
The only way to do that is to separate the performance of the initiative from the performance of the organization as a whole. And this requires an approach to modeling called unit economics.
Unit economics is so called because you’re modeling the economics of a single unit—as opposed to economics of the business as a whole. If you’ve ever wondered why investors are happy for some dotcom enterprises to lose millions of dollars a month for years before bursting into profitability (think Amazon.com), it’s because investors evaluate them in terms of their unit economics. Amazon.com had breathtaking unit economics from day one. It took about 10 years for the economics of the business as a whole to catch up!
Normal financial analysis is sufficient if a business is in a state of homeostasis (if it’s flatlining!) but if you’re trying to grow your businesses (and you are, aren’t you?), you need unit economics to evaluate your growth initiatives.
Let’s return to our fictitious business to see how this is done.
In this case, the unit we’re interested in is a new customer. We already know that two salespeople add an average of 25 customers a month. Each customer spends, on average, $1,000 a month and has a life of 36 months. The cost of the whole initiative is $200k a year (or $17k a month). From here we can derive that each customer is an annuity worth roughly $36,000 and that each new annuity is costing $667 ($17k / 25 clients).
That’s an annualized 433% return on investment. Not bad!
This means that, after the three-year ramp-up period, four inside salespeople would be sufficient to double this organization’s top-line revenue and then maintain it at this new level.
So, our board is pressuring management to shut down their sales initiative when they should be pressuring them to (at least) double it in size.
The fault is not with the board, though. It’s with management. By presenting the board with only standard financial reports, management is actually obscuring the true nature of reality. If your business is growing, it’s critical that you account for the economics of your growth initiative separate from the economics of the business as a whole. If you don’t, it’s likely you’ll find yourself in a similar position.
You can download my model here.

